Statistical Data Management and Analysis using R course provides an insight into quantitative data management and analysis (exploring, summarizing, statistical analyzing, visualizing). R is an open source software with many features for quantitative data management and analysis.
Why the Course?
Participants with interest in programming languages that allow work to be explicit & documented, promoting experimentation and exploration, and recording work-flow from start to finish will find this course useful and applicable.
Prerequisites
This course is designed with quantitative researchers as well as beginners in mind. It assumes no prior knowledge of statistics or quantitative research background. Participants will be expected to come with their own laptops.
Objectives
The course will:
- Introduce participants to R as a quantitative data analysis tool
- Enable learner master R software and R-studio as a user interface
- Enable learner import data from various sources
- Introduce basic statistics for exploratory data analysis including methods for describing and summarizing variable distributions
- Provide essential skills for data manipulation including selecting subsets and recoding
- Introduce the visual representation of variables in scatter graphs, bar charts, and histograms
- Examine the relationships between variables
Course Outline
Each session will include a lecture followed by practicals. Participants will also get a chance to see how data analysis is being applied in a real-life scenario. The following gives a brief summary of what the course will cover.
- Introduction to R: This entails installation of R and R-studio as well as relevant packages such as reshape2, readr, readxl, haven, dplyr, and ggplot2, etc
- Introduction to programming (basic syntax, Scripts – Documenting, commenting & sharing code)
- Loading and importing data into R: The learner will also be able to save data in R and perform data cleaning
- Data management and manipulation: The learner will study how to create and manipulate objects– Vectors, Matrices, Dates & Times.The learners will be required to learn to print conditional tables/filtering, sort data, append, merge and reshape datasets, and concatenate and order variables
- Descriptive statistical analysis: Learner will be taken through computations of measures of central tendency (mean, mode and median), measures of dispersion (variance, standard deviation, interquartile range, range, coefficient of variation), skewness and kurtosis
- Inferential statistical analysis: Learner will be introduced to Hypothesis testing;- parametric and non-parametric tests. This will be followed by correlation and regression( Simple and multiple linear regression, logistic regression) as well as survival analysis
- Visualizing: Basic plots that include:- Histograms, Multi–panel plotting, Boxplots, scatter plots, density plots and line plots, bar graphs and pie-charts
Modules
Full-time classes:
Date:
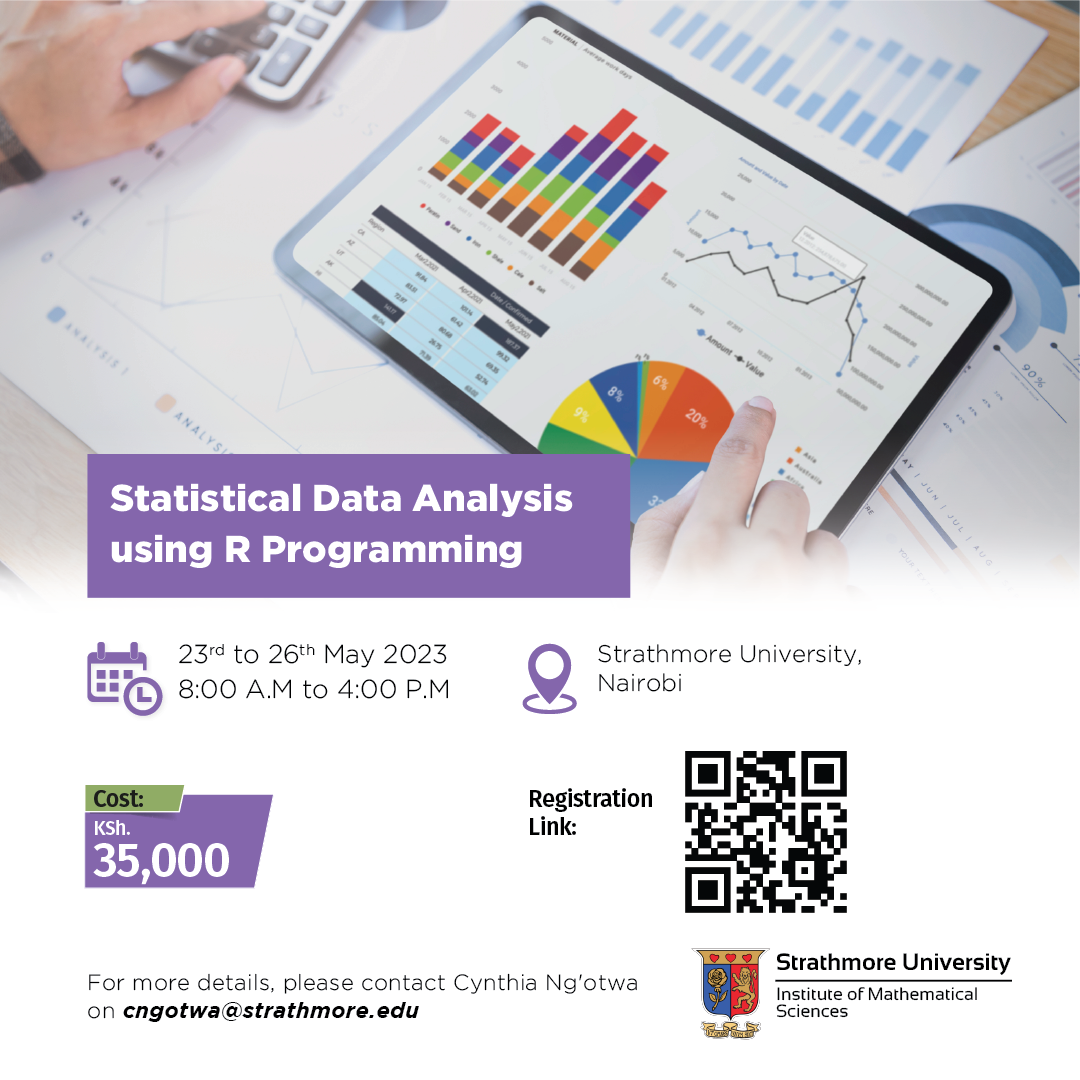
| 23rd – 26th May 2023 |
| 9th – 12th October 2023 |
Time: 9:00 am to 4:00 pm
Cost
Cost : KSh 35,000
Mode of payment
1. MPesa Paybill via CITI Bank
Input Amount: (the above cost details apply accordingly)
Account number: R PROGRAMMING COURSE
Business number:100219
2. Via Bank deposit
Name: Strathmore University
Bank: STANDARDCHARTERED
BANK Account Number and Currency: 0102044844000 (KES)
Bank Branch: Karen
Bank Branch Code: 075
Bank Code: 02
SWIFT Code: SCBLKENX
Cancellation Policy
For withdrawal cases, the portion of course fee to be refunded is based on date of notice as follows:
2 weeks before commencement of the course – Full refund
Less than 2 weeks before commencement of the course – 70% refund
On or after the date of commencement – No refund